Intuitive, data-driven design for human-centered product development.
Selected Work:
0-1 DESIGN
Rapid research and design to create a streamlined Event investigation workflow, reducing number of clicks from 6 to 2, and saving organizations $350K per hour.
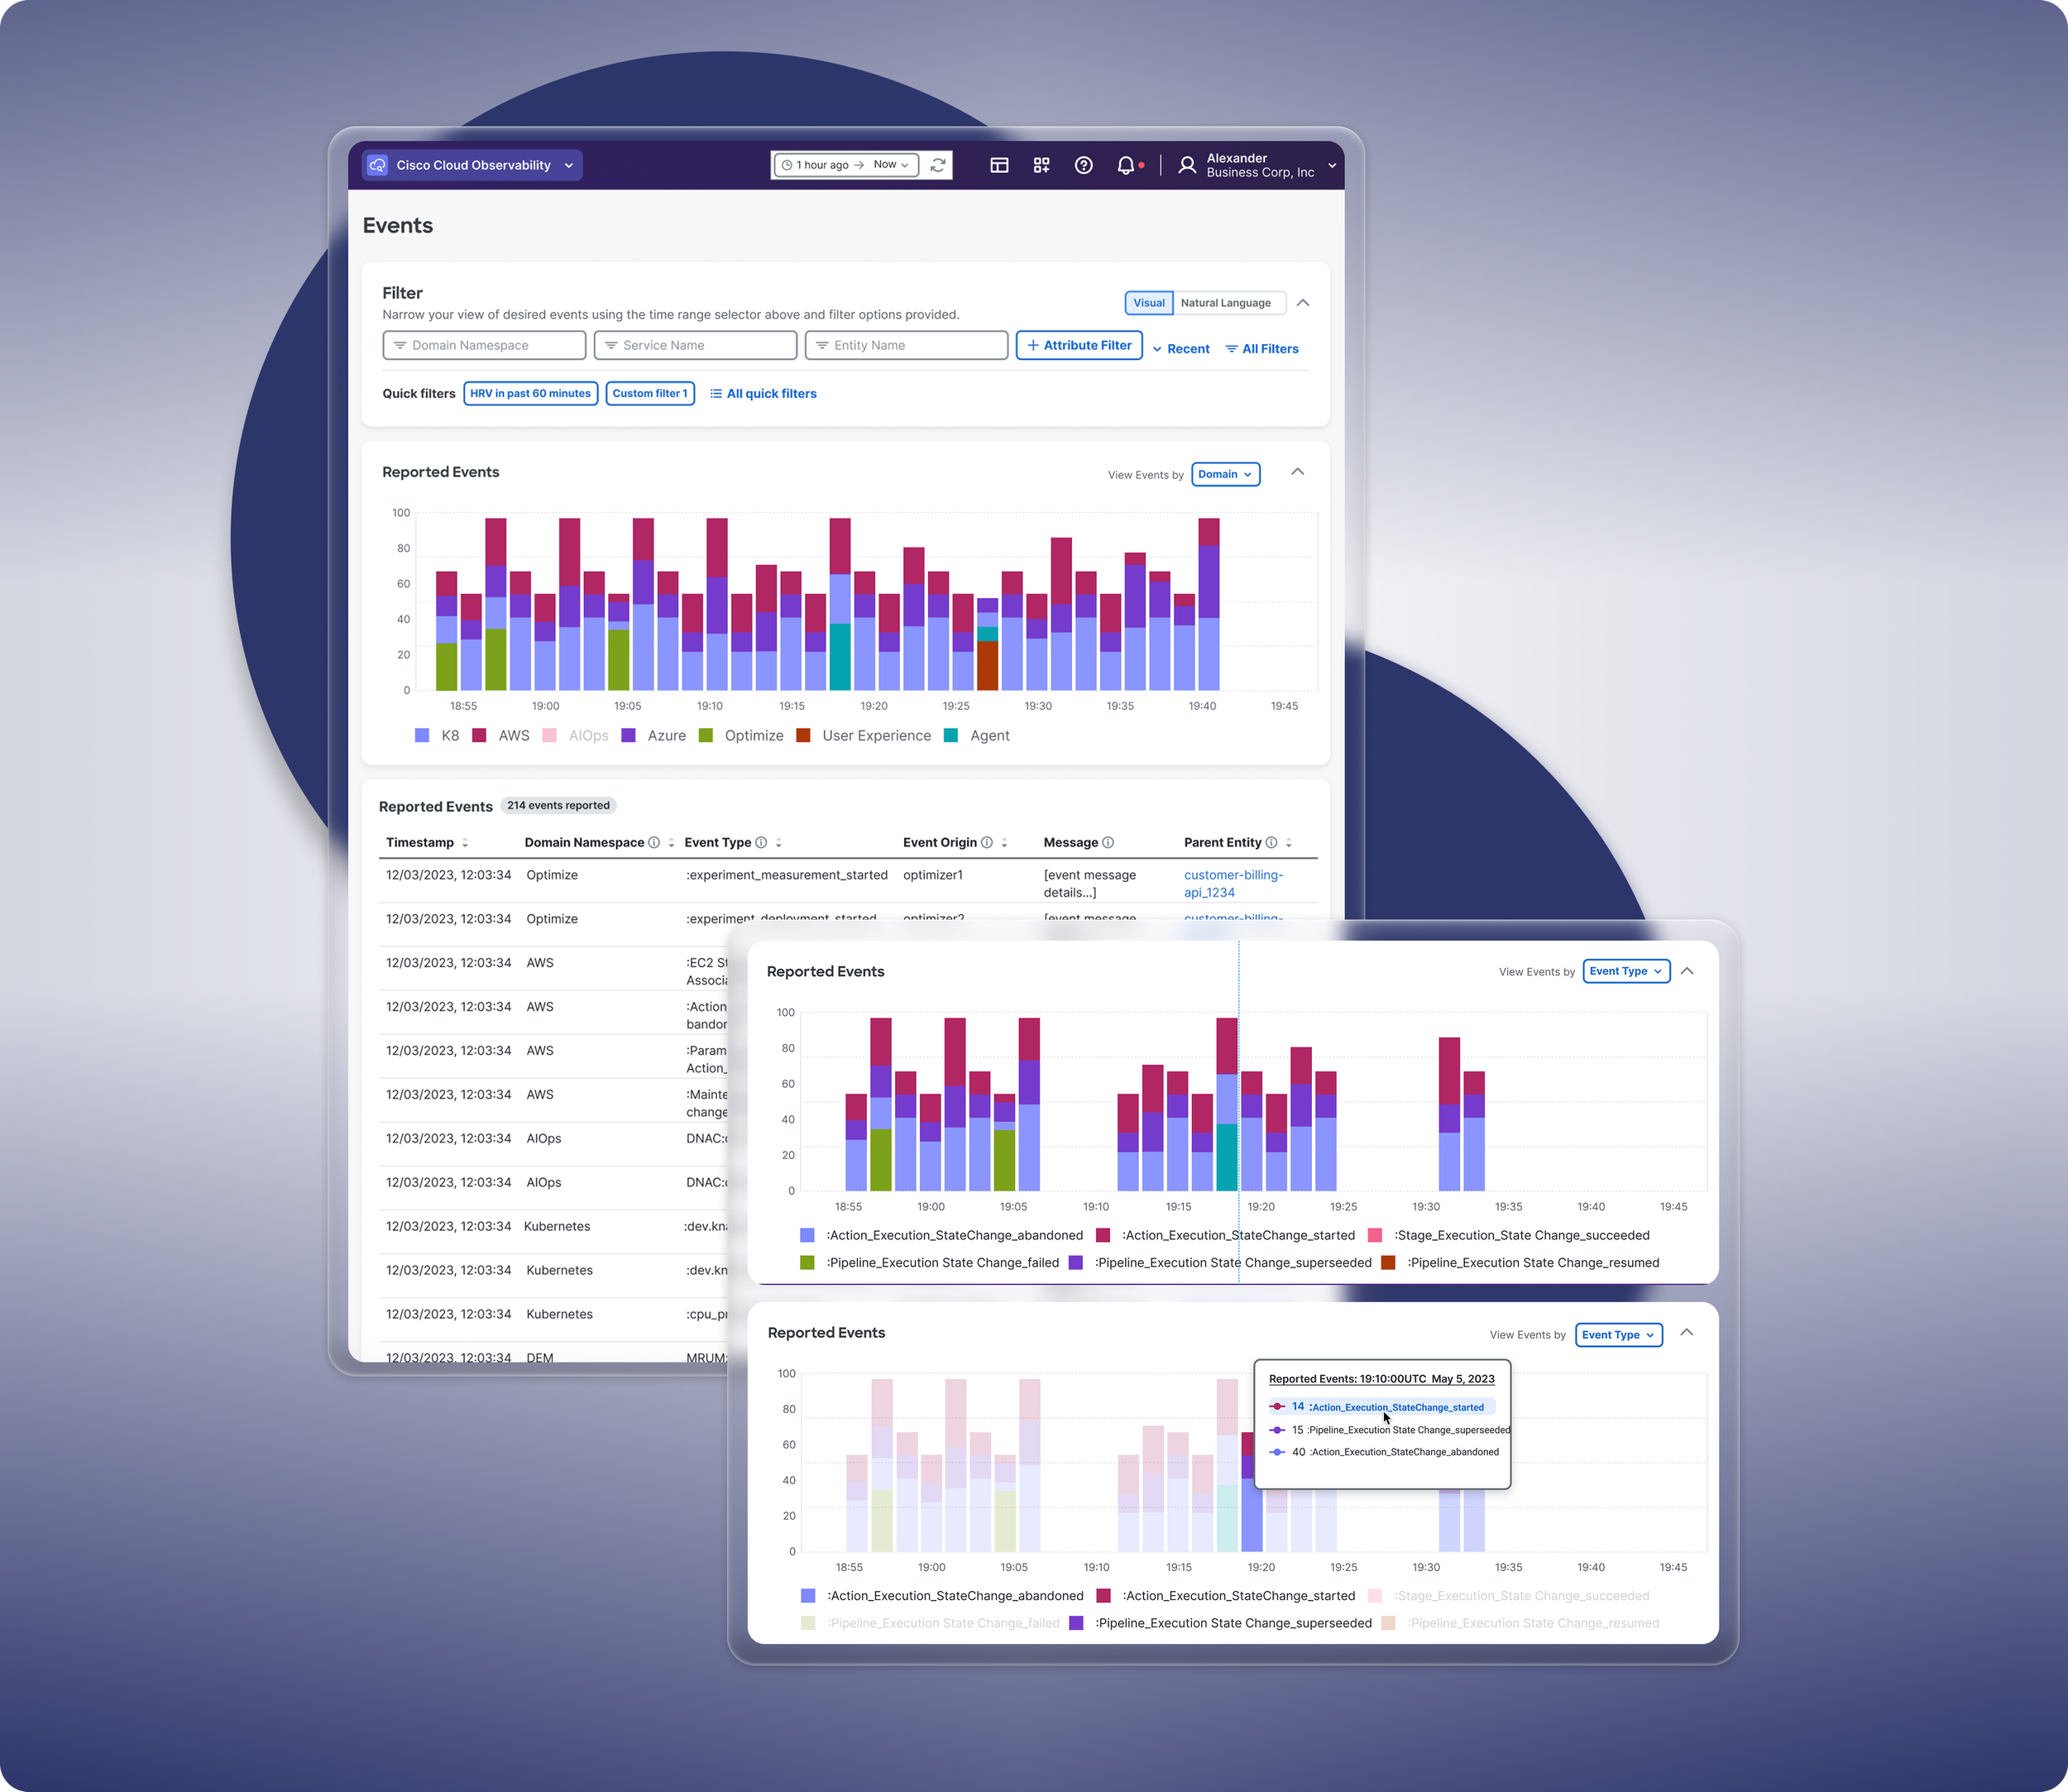
My Role: Design Lead/ UXR
Key Constraints: 4 weeks from ideation to build + QA
Product Line: Cisco Cloud Observability Platform
DASHBOARDS AND DATA VISUALIZATIONS
Driving a 9% increase in customer expansion renewals, YoY through iterative, user-centered designs simplifying product administration for Super Admin users.
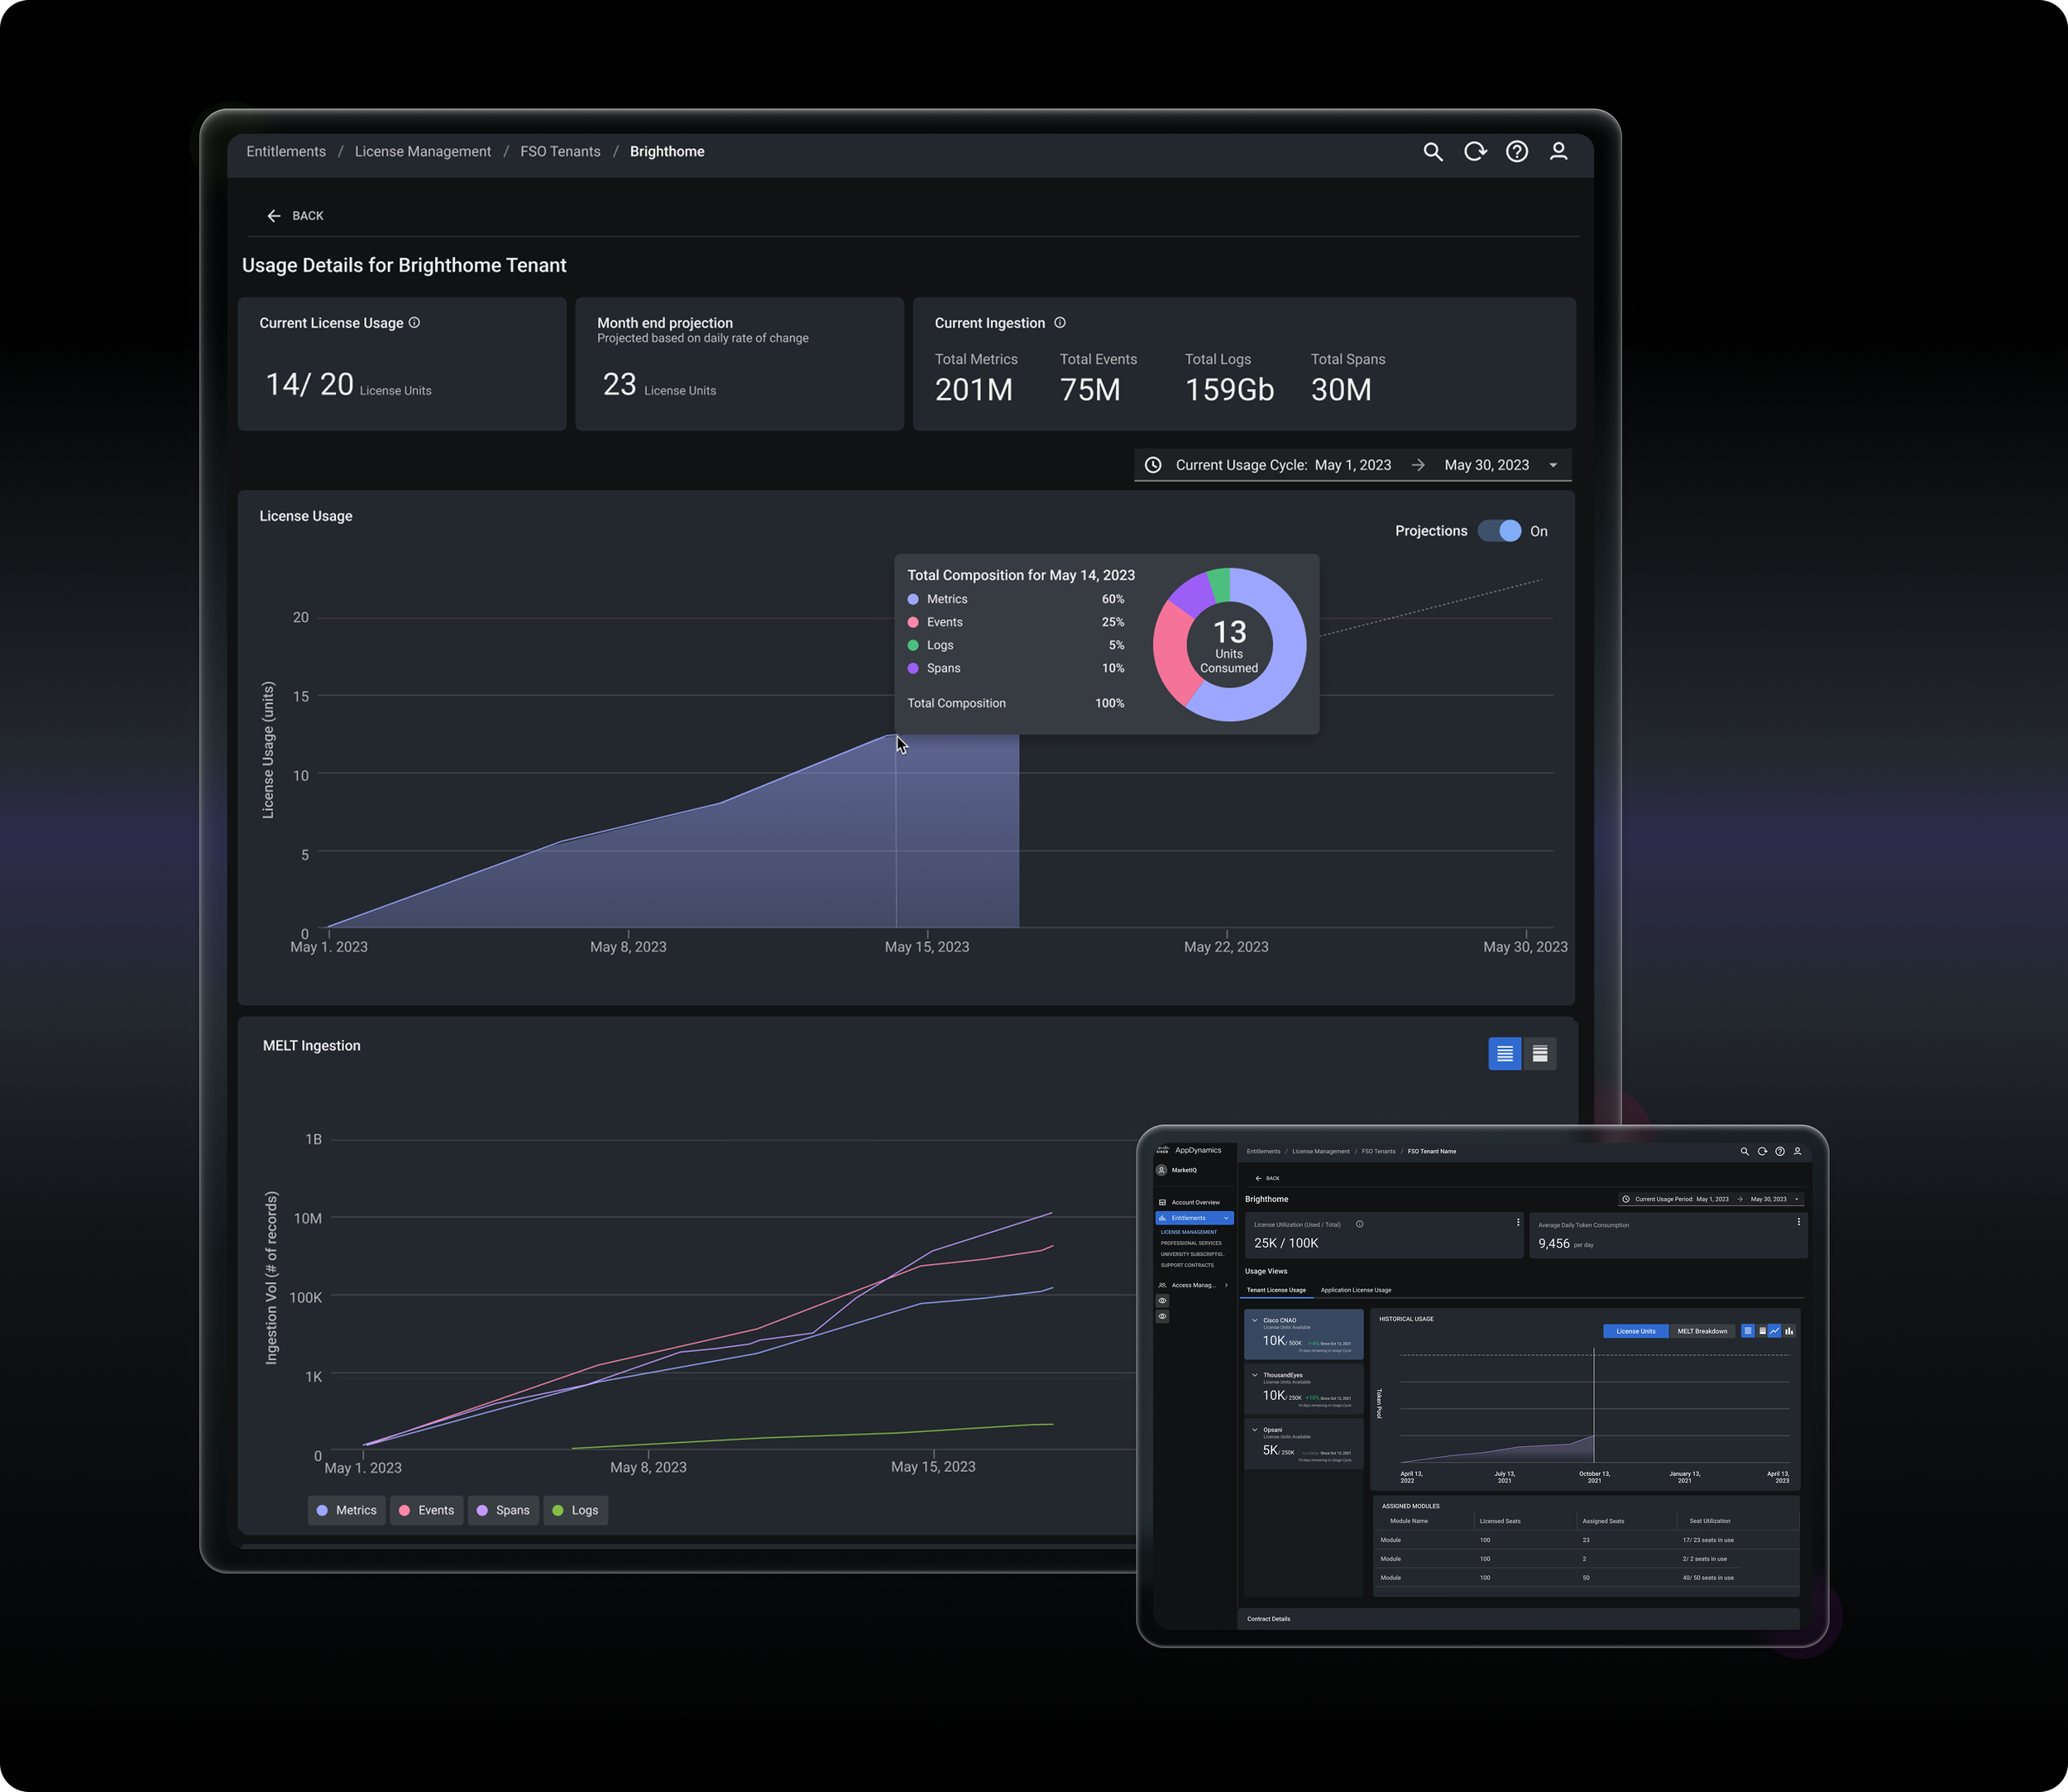
My Role: Lead Product/UX Designer
Scope: Continuous design and iteration
Product Line: Cisco AppDynamics Admin Portal
UXR SPIKE TO INFLUENCE PRODUCT STRATEGY
Reducing Mean Time To Value Through ML-Optimized Business Transaction Configuration

User Experience Researcher | 6 week UXR Spike | Cisco AppDynamics Controller [Configuration]
Research Questions: What is the core cause of friction during POV? How might automation decrease time to value and improve user experience with BT configuration?
Research Impact:
Secured dedicated Data Science resources to explore and develop ML-driven automation strategies for configuration workflows, reducing manual user effort.
Catalyzed design and content team efforts to reevaluate site navigation and Information Architecture, resulting in enhanced user experience and discoverability.
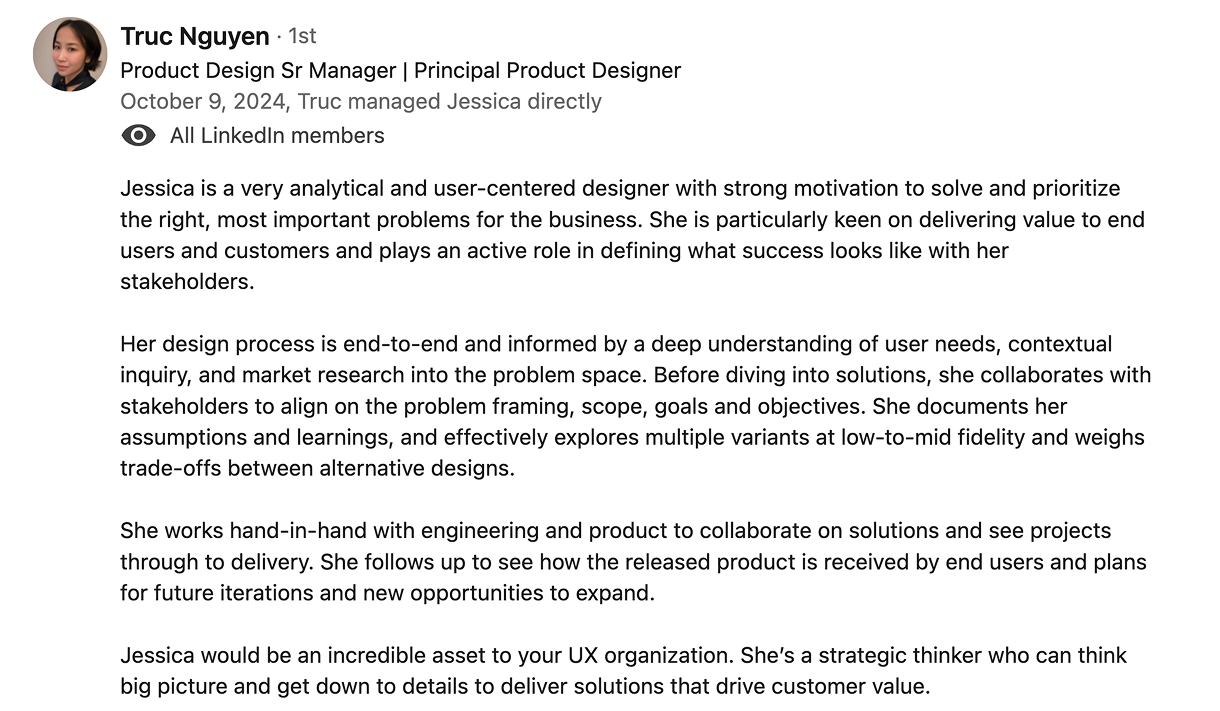
What People Are Saying:

Get in touch.
Send me a message using the form, or connect with me via LinkedIn